
Five-Year Trends Report
During the Five-Year Anniversary of Landscapes3 in 2024, the Planning Commission looked back at how successful we've been in implementing the plan's vision, goals, and recommendations. The Five-Year Assessment concluded that, overall, we've done pretty well in our continuing goal to balance growth and preservation.
As a final chapter in the five-year review, we considered what were top five most important trends that were not fully anticipated in Landscapes3 and what actions we might take going forward to address them. The major factor not anticipated in 2018 was the 2020 pandemic. This global event impacted almost every aspect of our lives and was a major influence in many of the top five new trends that we look at in this report. In choosing these trends, we also took into consideration the results of a survey conducted in the spring of 2024 to understand what residents and businesses viewed as important impacts of the last five years.
These trends will help inform our work program for the next five years and serve to lay the groundwork for the next update of Landscapes3 due to be completed in 2028.
Changes to How and Where We Work
The Trend

By the Numbers
In the years after the Great Recession, office building vacancy rates rose to 10% or higher, peaking at 12% in 2013 before declining to 7% in 2018. During the pandemic, office vacancies rose, hovering around 10% from 2021 through 2023. For 2024, the vacancy rate rose to 12%. (Source: CCPC The Chester County Economy, 2024)
Prior to the pandemic, the percentage of residents who "worked from home" ranged from 7.9% to 8.9%. But in 2021, 29.1% of residents worked from home, which was nearly one third of the work force. In 2022 and 2023, 22.2% and 21.3% worked from home respectively. (Source: US Census, 1 Year American Community Surveys)
A rapid transition to remote work for those with computer-based jobs was a significant result of the pandemic. While the ability to work from home either full or part-time was not a new concept, many workplaces were forced to fully transition to a remote work model almost overnight. Conversely, frontline and essential services workers did not have this option as their employers, at least temporarily, closed or they continued to report to work in person. The remote workplace structure continues to evolve as businesses grapple with decisions on bringing workers back into the office or allowing a remote work to continue, with many landing on a compromise of hybrid work.
Planning Implications
- Employees working remotely or coming to the office only a few days a week has impacted office vacancies. A trending increase in vacant or underutilized office space seen pre-pandemic became even more pronounced. Newer office spaces with more amenities are generally favored, creating more vacancy challenges for older office buildings.
- Remote work also influences land use and transportation patterns. For those who can work fully remote, they can live anywhere in relation to their place of work. Employees who only need to come into the office a few days a week may be more willing to take on a longer commute and live further from their employer, creating a higher demand for housing in places that were once considered outside of job centers.
- The ability to work further from home can have a positive impact for those who cannot afford to live in the area where they work and also lowers transportation costs. However, this trend can affect housing prices in what were once more affordable locations. Other changes to transportation patterns may occur as people's commuting routines change and they adjust how and when they run errands (e.g., during the day instead of on their way home from work). These locational impacts are likely to continually evolve as employers settle into final decisions on their employees' work locations.
- The expanded ability to work from home also had implications for increased demands for larger homes to accommodate both personal and workspace and highlighted the importance of access to high-speed internet services. A higher demand for local services, such as office supply stores, and more frequent walking and biking during the day are additional implications of the work-from-home trend.
- There is potential for some conversions to other uses, for example a proposed elementary school in Tredyffrin will use a former large office building. Limited reuse for needed housing is another option, although the layout of office buildings typically does not lend itself well to residential conversions.
Survey Connection
Respondents to the Landscapes3 Trends Survey identified the ability to work from home and an improved work commute as the first and third top trends that have personally impacted them most directly. Resolving employee preferences for working at home versus in-person rated moderately high as a trend that impacted their community, business, or place of work.
Landscapes3 Connection
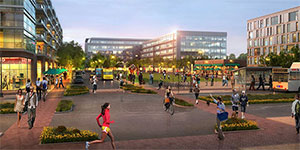
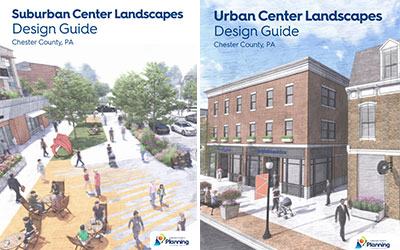
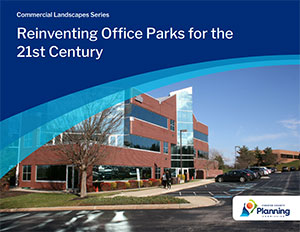
The trend in remote work and decreasing demand for office space was clearly recognized in the county's pre-L3 Commercial Landscapes Series: Reinventing Office Parks for the 21st Century (2017) (see p. 7). This publication had multiple recommendations for adapting to new office space demands. Landscapes3 also recognized these changing work trends in the Prosper Objective A: "Promote a diverse industry base and flexible workplaces that can adapt to rapidly evolving market, demographic, and technological trends." Two L3 Prosper recommendations that address this object are: "Create a countywide redevelopment program to revitalize underutilized properties." and "Encourage Suburban Center investment by increasing transportation amenities and creating an enhanced sense of place." Many of the other prosper recommendations also focus on providing a strong and diverse economic base in the county. The Landscapes3 Suburban Center and Urban Center Design Guides are relevant in making suburban and urban centers even more attractive to live and work.
Looking Forward
The issue that Landscapes3 did not foresee was the pandemic and the very rapid transition to remote work and more pronounced impact on office vacancy. However, many of the recommendations noted above, particularly in the "Reinventing the Office Parks" publication as well as the Design Guides are still relevant. Chester County's many amenities and high quality of place will continue to attract both employers and new residents, whether they are remote or in-person employees.
Actions to address these trends include:
- Amend zoning for office parks to allow for a mix of uses, including residential and commercial.
- Explore opportunities for converting underutilized office parks to industrial.
- Determine what local commercial uses and services are needed to serve people now working fully or part-time from home and consider if small retail uses (like coffee shops) might appropriate in some residential districts.
- Consider the need to expand sidewalks to address pedestrian safety in neighborhoods that now have a higher number of work-from-home residents and daytime pedestrians.
- Determine if limited increases of residential impervious coverage in zoning would better facilitate the need for in-home office space.
Pandemic Impacts on Transportation
The Trend
By the Numbers
During the three years prior to the pandemic, mean commuter travel time rose from 27.9 to 29.9 minutes. The year after the pandemic, working from home increased, which decreased traffic volumes, allowing for faster commutes. Mean travel time dropped to 25.3 minutes, then rose to 26.6 in 2022, and 27.9 in 2023. (Source: US Census, 1 Year American Community Surveys).
Prior to the pandemic, from 2017 to 2019, 7.9% to 8.9% of commuters residing in Chester County used public transportation. In 2021, transit use dropped dramatically to only 0.5%. For 2022 and 2023 it rose to 1.5% and 1.7%, respectively. (Source: US Census 1-Year American Community Survey)
SEPTA data for bus routes that cross into Chester County show that in 2019, average weekday ridership was 10,624. In 2020 and 2021, data was not gathered due to the pandemic. Ridership was 4,967 in 2022 and 4,944 in 2023, which is 46.5% of the 2019 ridership. (Source: SEPTA Data Analytics Section)
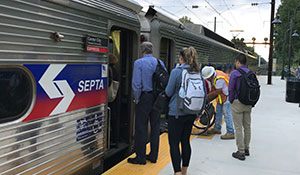
SEPTA data for regional rail stations within Chester County shows that in 2019, average weekday ridership was 9,867, but it dropped to 3,958 in 2020 due to the pandemic. As of 2023, it was up to 7,637, which is 77% of the 2019 ridership. (Source: SEPTA Data Analytics Section)
Data for AMTRAK-served rail stations in Chester County shows that in 2019, average weekday ridership was 1,831, dropping to 570 in 2020 due to the pandemic. As of 2023, it was up to 1,225, which is 70% of the 2019 ridership. (Source: AMTRAK Planning Department)
The pandemic had major impacts on the public transit system, particularly SEPTA's regional rail service, as well as weekday traffic and commuter patterns. While transit ridership had been growing pre-pandemic, it fell dramatically in the early days of the pandemic as many workers suddenly transitioned from going into Philadelphia every day to working from home. Although more workers are now going into the city, at least a few days per week, ridership has not yet recovered. Ridership patterns are also evolving, with increased interest in non-work trips to visit cultural or recreational locations in the city on weekends. Other more recent trends include SEPTA's "Bus Revolution" which provides some new on-demand transit zones and the creation of the Schuylkill River Passenger Rail Authority (SRPRA) and the possible return of rail passenger service to Phoenixville, Pottstown, and Reading.

Planning Implications
- More traffic is frequently seen during the day and rush hours are less predictable. There is often a reduced rush hour on Monday or Friday as people typically choose the beginning and end of the week as their "work-from-home" days with many offices being fuller mid-week.
- Adjusting transit services is needed to reflect the new ways people work and how they wish to use public transit. (SEPTA is looking at this now.)
Survey Connection
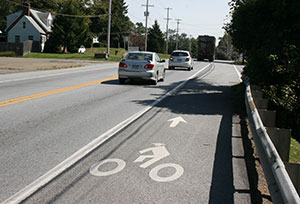
When reviewing the Landscapes3 Trends Survey results, it was found that the top priority was meeting travel needs and reducing traffic congestion through "demand management, road improvements, and public transportation options" under the "Economic, Transportation, Housing/Health Issues" section of the survey. The second highest priority was expanding trail network and active transportation options. Traffic congestion was also a frequently noted concern in the write-in comments. The reduced frequency of SEPTA regional rail was a noted concern as well as the need for public transit for employees. Connections to public transit and other services from residential areas via sidewalks and trails were desired.
Landscapes3 Connection
The Connect goal of Landscapes3 addressed transportation issues at several levels including recommendations for meeting the county's travel needs, reducing congestion, providing for integrated development of technology driven transportation options, and providing universally accessible sidewalks, trails, and public transit connections. A major effort to address active transportation and public transit topics was through the development of a county-wide trails master plan and a public transportation plan which were released in Fall of 2024 and approved in December 2024 by the Commissioners. These publications look at both pre- and post-pandemic conditions and impacts. The county created an Active Transportation Inventory in 2020 and undertook a direct municipal outreach initiative to assist local communities in expanding active transportation options. And, while it predates Landscapes3 by two years, the Multi-Modal Circulation Handbook (updated 2016) provides a wealth of technical information on how to accommodate all modes of transportation in land use and land development design.
Looking Forward
While Landscapes3 did not anticipate the pandemic and the impact it would have on public transit, the new public transportation plan recognizes these impacts and provides recommendations that reflect current conditions. The trail plan continues to address Chester County's long-term goals for advancing the county and region's multi-use trail network.
Actions to address these trends include:
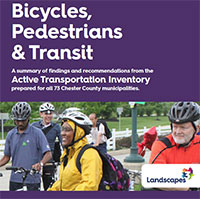
- Use the Active Transportation Inventory to implement specific identified municipal actions to expand active transportation options.
- Review and implement recommendations of the Chester County Public Transportation Plan and the Chester County Trails Master Plan.
- Identify and participate in the biennial update of the Transportation Improvement Inventory, which is a comprehensive record of known transportation needs and projects within Chester County.
- Take advantage of new Federal funding programs as they become available.
- Address local small scale congestion points that may have been impacted by increased work-from-home traffic.
Commerce and Industry Trends
The Trend
By the Numbers
New non-residential development in Chester County has exceeded 900,000 square feet every year since 2016. In five of the last eight years, it exceeded 1,000,000 square feet. (Source: CCPC, 2023 Non-Residential Construction Report)
In the last five years, a number of commercial and industrial developments over 100,000 square feet in size were constructed in locations around the county including Sadsbury, Tredyffrin, Uwchlan, Upper Uwchlan, and New Garden townships. (Source: CCPC, Annual Non-residential Construction Report 2019-2023)
The vacancy rates for retail and industrial buildings were not dramatically impacted by the pandemic. Between 2015 and 2024, retail building vacancy rates ranged between 4% to 6%, with the highest vacancy rate of 6% occurring in 2022 and most recently 5% in 2024. The industrial building vacancy was quite stable ranging between 4% to 5% during that time. This stability is likely because working from home is not an option in these sectors as it is in the office sector. (Source: CCPC The Chester County Economy, 2024)
According to the US Census, from 2014 through 2023, employment in manufacturing has ranged from 28,950 in 2017 to a high of 32,632 in 2019. As of 2023, 30,322 persons or 10.3% of the population were employed in manufacturing, showing a decrease following the pandemic. Overall, during this 10-year period, the percentage of county residents employed in manufacturing has stayed steady at just under 11% on average. (Source: US Census, 1 Year American Community Surveys)
During the five years from 2020 to 2024, the Planning Commission reviewed 31 warehouse proposals, totaling over 4.8 million square feet. The highest number for both number of proposals and square footage received was in 2021 totaling 8 proposals and nearly 2.3 million square feet. Annual warehouse submittals during this time period were consistently higher than in the prior three years.
During the five years from 2020 to 2024, the Planning Commission reviewed 68 industrial development proposals, totaling over 7.4 million square feet. The highest number of both proposals and square footage received was in 2021 totaling19 proposals and 2.9 million square feet. Annual industrial submittals during this time period were consistently higher than in the prior three years.
Several economic trends changed or continued at a faster pace after Landscapes3 was adopted in 2018. The county saw continued efforts to reuse and repurpose older commercial areas that have become obsolete or have high vacancy rates, such as malls and shopping centers. The pandemic put further stress on "brick and mortar" businesses as people turned to online shopping and services to an even greater degree. Demand for warehouse space to accommodate online purchases increased and more delivery trucks were seen multiple times per day in neighborhoods. Worker shortages became more pronounced, especially for frontline services where in person contact was not optional, and supply chains were disrupted. The county also began to see an increased number of industrial and manufacturing proposals since 2018, a positive job creating trend although total employment in the sector did fall somewhat immediately following the pandemic.
Planning Implications
- Planning and flexibility in land use regulations may be needed to allow for repurposing of older commercial uses.
- Appropriate areas, with access to transportation and infrastructure, are needed to accommodate a variety of manufacturing and warehouse sizes and intensities.
- Workforce development continues to be an important issue for county businesses to thrive.
Survey Connection
Those who responded to the Landscapes3 Trends Survey rated the accelerated impact of online retail on brick-and-mortar businesses as the highest impact on their community business, followed by the inability to find employees to fill job openings. Write-in responses included concerns about the impact on stores and businesses such as less stock, staffing shortages, reduced hours, and stores closing altogether. Another respondent noted that decreased profits and inability to complete projects due to supply shortages and slowdown of mail service was a concern. The priority to reuse and redevelop vacant and underused commercial areas over the development of greenfields was noted.
Landscapes3 Connection
The Prosper goal of Landscapes3 anticipated many of these trends, particularly the need to support redevelopment and coordinate and support workforce development. Housing affordability was recognized as a barrier to workforce development. Recommendations were included for growing and expanding a skilled workforce as well as creating a countywide program for revitalizing and underutilized properties. (Housing Affordability is addressed in Trend 4.) Flexible zoning was also recommended to accommodate a range of development opportunities.
Several projects have been completed that address these issues including a pre-Landscapes3 publication on Transforming Greyfields into Dynamic Destinations (2017) located on the Commercial Landscape Series webpage. The Planning Commission also created a Development and Redevelopment Opportunities webpage which encourages reinvestment in growth areas that already have supportive infrastructure. The webpage includes a Reinvestment Strategies and Tools section that provides a wide range of valuable information on how municipalities can help to encourage reinvestment of properties through planning, promoting, and land preparation. A centerpiece of this page is a Reinvestment Indicators map that allows the user to drill down on finding specific locations in the county with redevelopment potential based on infrastructure availability and lack of site constraints. The Landscapes Design Guide series, particularly for the Suburban, Urban, and Rural Centers, was developed after Landscapes3 was adopted to provide specific design and planning guidance for the county's growth centers.
Early in the pandemic the Planning Commission, working closely with the Chester County Economic Development Council (CCEDC), created an economic recovery page focused on helping businesses that were struggling with shutdowns and other major issues employers were dealing with at the height of COVID. Fortunately, that website was no longer needed and relevant economic information was transferred to the Economic Development section of the Planning Commission's website. The CCEDC also focuses much of its efforts on workforce development recognizing that building, sustaining, and retaining a viable workforce, improves economic success for individuals, businesses, and communities. For more information on these efforts, see the Workforce Development section of their website.
In 2021, the County Commissioners created the Department of Workforce Development (DWD) as part of a restructuring of county agencies addressing human services. The DWD is responsible for the strategic planning and promotion of an effective workforce development system.
Looking Forward
While Landscapes3 did not foresee the pandemic, it addressed the importance of continued economic growth in the county through multiple efforts. Planning guides, publications, eTools, and other resources developed even before Landscapes3 was adopted supported implementation of the Prosper goals and continue to provide valuable information to the county's business community. Landscapes3 also protects the many qualities of Chester County, including open space, natural and cultural resources, and vibrant urban areas, which contribute to the county's continued appeal as a place to live, work, and raise a family.
Actions to address these trends include:
- Continue to update and enhance the Planning Commission's efforts already completed and underway to support the county's economy.
- Continue working with important partners such as the CCEDC, the Chester County Chamber of Business and Industry (CCCBI), and local chambers of commerce.
- Assist municipalities in understanding newer retail trends and adjusting zoning in retail areas as appropriate.
- Protect industrial land from rezoning or the inclusion of non-industrial land uses to ensure a sufficient supply of industrial zoned land.
- Ensure that "mega-warehouses" are only permitted in areas where major highway access is available. Transportation and utility capacity should also be assessed for industrial and warehouse last mile delivery needs.

Housing Affordability 2.0
The Trend
By the Numbers
Interest Rates — During the 2000s, the weekly 30-year fixed rate mortgage average in the United States usually ranged between 5% and 7%, sometimes exceeding 8%. During the 2010s, the range fell to between 3% and 5%, and this continued through 2021. In 2022, interest rates began a steep rise from around 3% to about 7% at the end of 2022. From 2023 through 2024 the rate ranged between 6.5% and 7.5%. (Source: Federal Reserve Economic Data, December 2024.)
Housing Prices — In 2023, the median price of housing in Chester County was $492,000, the highest it has ever been even adjusted for inflation. From 2019 to 2023, the increase in housing prices was $68,242, or 16%. Over the last 30 years, it exceeded $460,000, adjusted for inflation, only four times: 2006, 2021, 2022 and 2023. (Source: CCPC.)
Over the last 30 years, the highest annual housing unit sales in Chester County was 10,240 units in 2003. By 2011, the number of units sold had gradually declined to 4,952 units annually. In 2020, sales rose dramatically to 7,532 in 2020, topping out at 9,049 in 2021. Then, in just two years, there was a steep drop in sales to 5,439 units in 2023. (Source: CCPC.)
Affordably priced housing has long been recognized as a significant need in Chester County. The issue of affordable housing became even more pronounced during and after the pandemic with an accelerating rise in both prices and rents. Factors affecting price increases included higher demand for homes, particularly for those newly working from home and desiring more space, coupled with a limited availability of homes on the market. A rapid rise of mortgage rates from historic lows to control inflation made new mortgages even less affordable for entry or mid-level buyers who did not have significant home equity from current homes. Homeowners with existing low mortgage rates were reluctant to sell their homes and take on a new, higher rate mortgage, resulting in a lack of turnover, further reducing the number of homes coming onto the market. Another factor affecting housing availability is the increasing number of seniors who are opting to age in place. Regulatory barriers, restrictive zoning, resident opposition, and high land costs have also contributed to a deficit of new construction to meet the increasing household demand in the county. While interest rates started to come down in 2024, the rapid increase in home prices and the availability of "missing middle" homes is expected to be a long-term issue in Chester County, as well as many areas of the country.
Planning Implications
- Economic development may be hindered by the lack of affordably priced housing for the county workforce.
- The housing market is heavily impacted by interest rates which are largely out of local or state control.
- A diversity of housing options that are affordable and available across all ages, incomes, and abilities are a cornerstone of community well-being.
- There is an impact on transportation from those commuting from areas outside the county where there is greater access to affordable housing.
- Lack of affordable housing for essential workers can cause difficulty in filling jobs and declines in services.
- The decreased housing supply, as described above in Trends, has led to increasing housing prices and fewer starter homes. This in turn has led to Chester County seeing a decline in family households, while the aging population increased. If this trend were to continue, eventually school enrollment would decline, and the growing senior population would increase demands on emergency services and hospitals.
Survey Connection
The results of the Landscapes3 Trends Survey showed the inability of employees to find workforce housing as the third highest concern noted under community and business impacts in the past five years. Increased housing costs and decreasing housing availability ranked high (just under 2nd place) for economic related priorities that should be addressed in the coming five years. Write-in respondents also noted a need for affordable housing for seniors in specific areas of the county as well as housing for special needs residents. The high cost of rentals and the challenges faced by first time homebuyers was noted under previous issues identified in Landscapes3 that are of continuing concern. Affordable housing was identified as an important component of workforce development.
Landscapes3 Connection
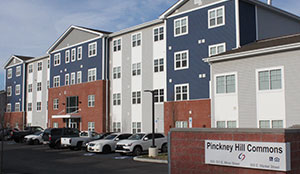
Providing opportunities for a diverse housing mix and accommodating housing at costs accessible to all residents were two important components of the Landscapes3 Live goal (see Live objectives A and B). Specific recommendations made to support the implementation of those objectives in Landscapes3 included: Providing housing and policy ordinance assistance, identifying new approaches for affordable housing, and exploring public/private partnerships for workforce housing (see Live Recommendations 1-4).
Since the adoption of Landscapes3, the Planning Commission has put significant effort into building on its prior housing efforts with the implementation of the A+ Homes initiative. This initiative is being undertaken in conjunction with the Housing Choices Committee, created in 2019 with a wide range of housing partners. The annual A+ Homes Forum features ideas and initiatives provided by a wide range of housing experts. An interactive map of Housing Opportunity Areas was created to show where zoning allows moderate density housing within the Landscapes3 Growth Areas. The Starter Home Pilot for expanding attainably-priced homes for first time homebuyers was opened to municipalities in 2023. Other resources made available to municipalities through our Housing webpage include the annual update of the Chester County Housing Report, the Missing Middle Housing Guide, planning tools for municipalities, case studies, and partner links. The Planning Commission's strong support of the 2020 Census, which resulted in the second highest response rate in the Commonwealth, helps to ensure that the county can receive valuable population and need based assistance. Multiple housing initiatives have also been advanced by housing partners and can be viewed on the Live success stories webpage.
Looking Forward
In addition to the housing initiatives noted above, the Planning Commission continues to explore a number of innovative options for expanding affordably priced housing, including the concept of land banking. More information will be shared as these initiative progress in the next five years.
Actions to address these trends include:
- Continue to coordinate with housing partners to advance the principles of A+ Housing initiatives, particularly those focused on the aspect of affordability.
- Expand and support municipal housing planning efforts including developing or updating local housing plans.
- Assist municipalities in identifying and reducing regulatory barriers to affordable housing or which run counter to fair housing needs.
- Produce materials that can be used to counter affordable housing "NIMBYism" in communities.
- Create a land bank for affordable housing projects.
- Seek additional funding and resources to support these and other housing initiatives.
Climate Change Impacts and Sustainability
The Trend

By the Numbers
Electric Vehicles — Over the last ten years EVs have significantly increased in Chester County. In 2014, there were 116 EVs in the county with this number rising steadily to a total of 6,106 in 2023. (Source: PennDOT, Report of Registrations for Calendar Year 2014-2023)
Solar Power — There has been a substantial and steady increase in the amount of solar generated energy within Chester County over the past five years. In the period from 2019-2023, 15.18 megawatts of power were generated and while 1,127 new solar projects were constructed. For the prior five years (2014-2017), 9.39 megawatts were generated, while 783 new projects were built. (Source: Pennsylvania Alternative Energy Credit Program Qualified Facilities Report, Downloaded October 2024)
Population Living in the Floodplain —
- The Chester County population living in the 100-year floodplain was 211,361 (or 42.3% of the total population) in 2010. In 2020, this population increased to 217,767 (or 40.7% of the total population), representing an increase of 6,406 over the ten-year period. (Sources: 2010 and 2020 Decennial Census, and FEMA floodplain mapping)
- The Chester County population living in the 500-year floodplain was 227,477 in 2010 (or 45.6% of the total population) in 2010. In 2020, this population increased to 236,361 (or 44.2% of the total) representing an increase of 8,884 over the ten-year period. (Sources: 2010 and 2020 Decennial Census, and FEMA floodplain mapping)
View metrics showing our progress in addressing climate action goals.
Since Landscapes3 was adopted in 2018, the county has placed a more urgent focus on efforts to address climate change and reduce greenhouse gas emissions. The county and many municipalities are looking towards accelerating a clean energy transition within their own facilities and in the wider community. Electric vehicles (EVs) have become increasingly popular and significant efforts regionally and nationwide are being directed towards expanding supporting EV charging infrastructure. Additional focus has been placed on not just slowing climate change, but also on mitigating the related impacts the county is experiencing including increased storm intensities, more widespread flooding, and more frequent and prolonged extreme heat events. More recently, significant increases in federal funding have become available to address climate change and move towards clean energy sources and are particularly focused on ensuring disadvantaged communities benefit from the transition to clean energy.
Planning Implications
- Actions to address climate change and mitigate its impacts need to be explicitly considered as part of the county's ongoing planning efforts.
- As flooding and storm intensities increase, population living in the 500-year floodplain is at increased risk.
- Coordination at a regional level should be undertaken where it can more effectively address sustainability actions such as placement of public EV infrastructure or shared clean energy purchases.
- The county should be prepared with potential project ideas to take advantage of Federal or state grants as they become available.
- The county should support municipalities through planning technical assistance in their local efforts to reduce greenhouse gas emissions and mitigate the impacts of climate change.
Survey Connection
The Landscapes3 Trends Survey respondents identified the need to address impacts of flooding and other extreme weather events as an important effort regarding trends most directly affecting individuals or their families. In the survey question specific to Environmental/ Sustainability issues, the highest ranked priority was increasing community resiliency for extreme weather events followed by planning for a transition to clean energy sources. Write-in responses included the urgent need to address climate change and extreme weather events and flooding. The reduced use of plastics and the importance of reducing waste and increased recycling were also noted along with the protection of natural resources, green spaces, wildlife habitat; transitioning lawns to pollinator habitat; reducing the overuse of pesticides; and reducing light pollution. Regarding environmental issues that had previously been identified as high priorities in Landscapes3, respondents' current top priorities were, ensuring a supply of safe, clean water, protecting the county's open spaces, protecting natural resources, and improving stormwater infrastructure and flood resiliency.
Landscapes3 Connection
While Landscapes3 made limited specific references to the issue of climate change, many of its goals, objectives, and recommendations directly or indirectly promoted sustainable actions and would result in the reduction of greenhouse gases. The Protect goal and its objectives to comprehensively protect ecosystems and natural resources and address flood mitigation and resiliency move towards a sustainable environment. The Connect goal and related objectives to reduce congestion, provide universally accessible sidewalks, trails, and public transit connections, and promote safe and sustainable energy systems would directly impact goals for greenhouse gas reductions and slowing climate change. Connect recommendation 9 was specific to supporting a wide range of energy resources, distribution system alternatives, and conservation measures to create a more resilient energy network and address climate change.
Shortly after the adoption of Landscapes3, the county embarked on two major sustainability initiatives, first with authorizing the creation of the Chester County Environmental and Energy Advisory Board in 2019 followed by the development of the Chester County Climate Action Plan and its adoption in 2021. As a result of recommendations and public input during the development of the Climate Action Plan, the County Commissioners created the position of Sustainability Director in 2022. The Sustainability Director oversees the Sustainability Division located in the Planning Commission and leads the Climate Action Plan implementation initiatives. Under the guidance of the Sustainability Director, county operations have embarked on multiple greenhouse gas reduction activities and other sustainable actions. One of these efforts involved creating a new consortium through which the county and other public entities can procure renewable energy, opening up opportunities for municipalities to reduce their carbon footrprint. In addition to internal efforts, the Sustainability Director also provides guidance and assistance to Chester County communities, residents, and businesses to further the implementation of the Climate Action Plan's community-wide goals and objectives and their local sustainability actions. Significant coordination has taken place with environmental partners as well to advance mutual goals. Multiple resources have been made available such as the widely expanded Clean and Sustainable Energy page which provides information on solar energy, electric vehicles, funding sources, sample ordinances, and climate planning resources. The Sustainability Division conducted an inventory of municipal ordinances regulating solar power and provided general as well as tailored guidance for reducing barriers to solar power. Assistance to Homeowners Associations in implementing sustainable practices was a major effort in 2024 and will continue into 2025. A webpage focusing on Woodlands and Tree protection provides a one-stop resource to protect and expand the county's woodlands, tree canopy, and individual trees. Progress on implementing the Climate Action Plan can be viewed on the Measuring Progress webpage. An update of the Climate Action Plan is anticipated to begin in late 2025.

Looking Forward
The Planning Commission, with the guidance of the Sustainability Director, will continue to lead the county's internal and community-wide efforts to address climate change and sustainability on multiple levels.
Actions to address these trends include:
- Support ongoing and new efforts to address climate change and mitigation of its impacts in the county and region as outlined in the Planning Commission's work program.
- Take advantage of new resources or funding that support implementation of climate planning goals and initiatives as they become available.
- Include the concept of green infrastructure and sustainability into municipal planning work to approach its implementation more comprehensively and effectively. These actions could range from green stormwater infrastructure to EV charging, building energy benchmarking and alternative energy ordinances.
- Provide assistance and input on the update of the Chester County Hazard Mitigation Plan, particularly in those areas that are impacted by climate change and support municipalities most vulnerable to climate hazards in accessing resources.